Pricing Details
Free Tier: Experience Graphy with a 14-day free trial. Pro Tier: The Pro Tier starts at $15.00 per month. Disclaimer: Please note that pricing information may not be up to date. For the most accurate and current pricing details, refer to the official Graphy website.
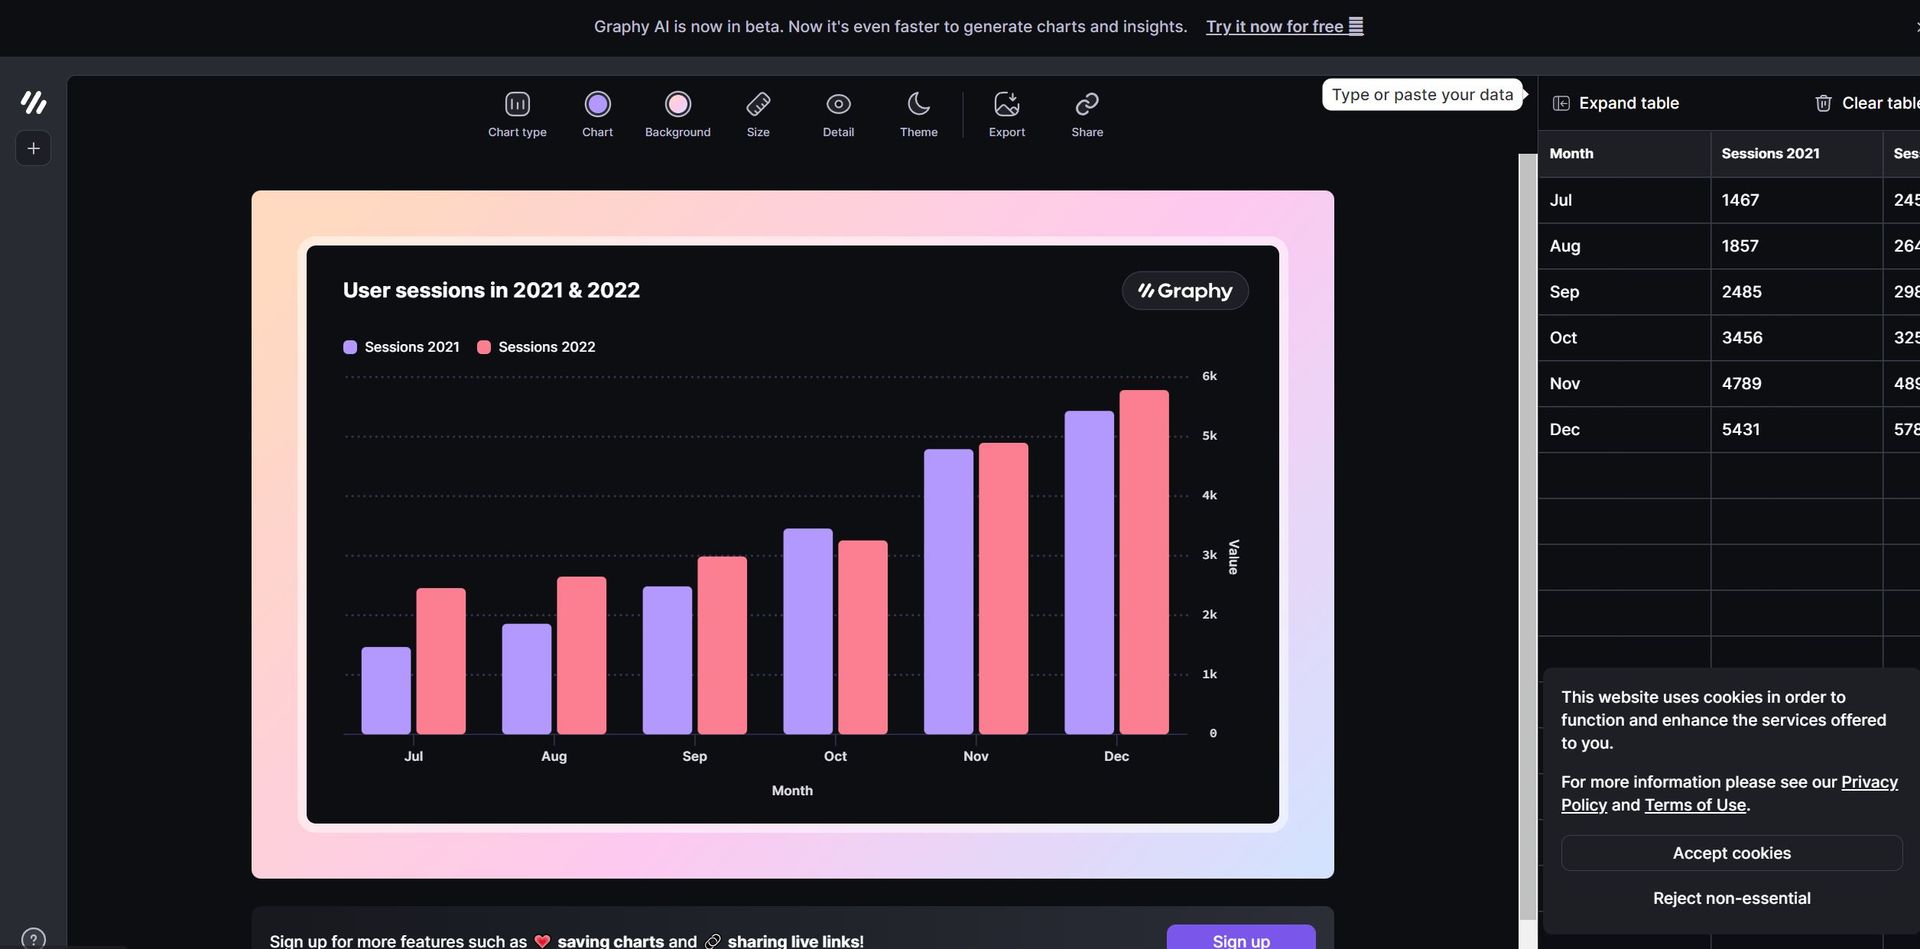
Product Visuals (1 images)
Strengths
- Time Efficiency: Significantly reduces the time required to create and share professional graphs.
- Enhanced Collaboration: Facilitates team collaboration with easy sharing options and integrated platforms.
- Beautiful Visuals: Produces visually appealing graphs that impress stakeholders and keep everyone aligned.
- Actionable Insights: Focuses on creating graphs that drive decisions and reduce ambiguity.
Limitations
- Limited Customization for Advanced Users: While easy to use, some advanced users might find the customization options limited.
- Integration Scope: Currently supports a specific set of third-party tools; expanding this could increase versatility.
What You Get
Key Features
- Lightning Fast Performance: Creates graphs 80% faster than other data visualization tools.
- User-Friendly Interface: No learning curve, with a simple and intuitive design packed with powerful features.
- AI-Generated Insights: Automatically generates insights and graphs, saving time and effort.
- Rich Storytelling Capabilities: Enhances data presentation with visual annotations, goals, and trend lines.
- Seamless Data Integration: Connects easily with Google Sheets and allows data pasting from various sources.
- Multiple Sharing Options: Share graphs as embeds, interactive links, or images across platforms like Notion, Canva, Slack, and more.
- ProsTime Efficiency: Significantly reduces the time required to create and share professional graphs.Enhanced Collaboration: Facilitates team collaboration with easy sharing options and integrated platforms.Beautiful Visuals: Produces visually appealing graphs that impress stakeholders and keep everyone aligned.Actionable Insights: Focuses on creating graphs that drive decisions and reduce ambiguity.ConsLimited Customization for Advanced Users: While easy to use, some advanced users might find the customization options limited.Integration Scope: Currently supports a specific set of third-party tools; expanding this could increase versatility.
Best For
- E-commerce Businesses: Utilizing the tool for enhancing online product imagery and sales reports.
- Digital Marketing Agencies: Employing the tool for creating visually appealing campaign content and performance reports.
- Social Media Managers: Leveraging the tool to create engaging social media posts and analytics.
- Graphic Designers: Using the tool for efficient design workflows and client presentations.
- Uncommon Use Cases: Utilized by educational institutions for teaching marketing courses; Adopted by freelance photographers for streamlining editing processes.
Integrations
Google Sheets Integration: Easily connect and visualize data from Google Sheets. Notion: Embed and share graphs within Notion for enhanced project management. Canva: Integrate with Canva for creating comprehensive visual content. Slack: Share graphs directly in Slack channels for team collaboration. Microsoft PowerPoint: Embed graphs in PowerPoint presentations for impactful reports.
Similar Tools
Weekly Issue
⚡
Spreadsheets tools · weekly digest
The AI Weekly — free in your inbox
New AI tools, pricing changes, expert picks, and hidden gems — curated by Mr. Spark every week. Join 5,000+ readers who stay ahead of the AI curve.
No spam, ever
Unsubscribe anytime
100% free